Learn how the data and metrics are calculated and displayed in your dashboard.
Please note the metrics will appear once there's at least 2 published newsletter as the dashboard required 2 published letter to make the comparisons and get the metrics variations.
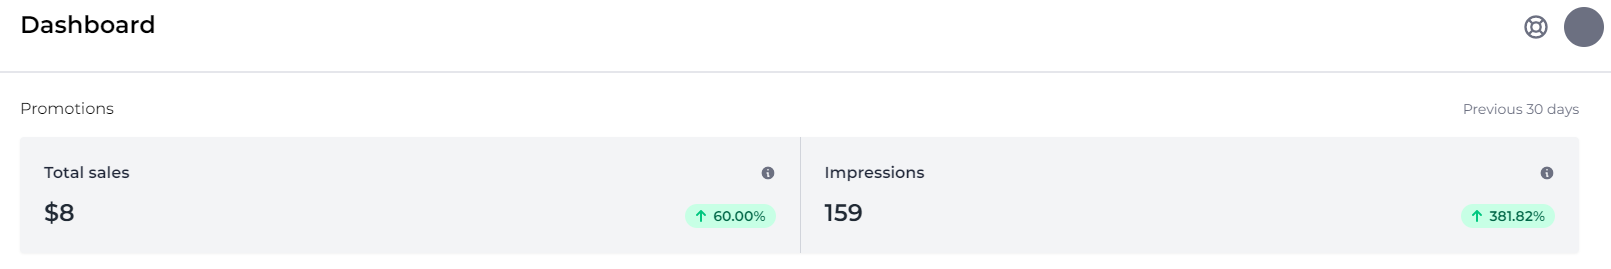
Promotions
- The Promotions section displays a snapshot of data about your promotions revenue and engagement during the past 30 days.
- Total sales
- Total sales are the sum of all self-service and direct-sold promotion revenue over the past 30-day period.
- Percent change is a comparison of the sum of direct-sold and self-service revenue earned during the past 30 days versus the same data for the prior 30-day period.
Impressions
- Impressions are a sum of the number of times your promotions have been rendered in the past 30-day period.
- We measure whether a promotion is rendered based on an impression pixel attached to each promotion. If your end-users disable image loading in their emails, the impression pixel will not render for that user and no impression will be recorded.
- Percent change is a comparison of the sum total of promotion impressions made during the past 30 days in comparison to the sum total of impressions for the prior 30-day period.
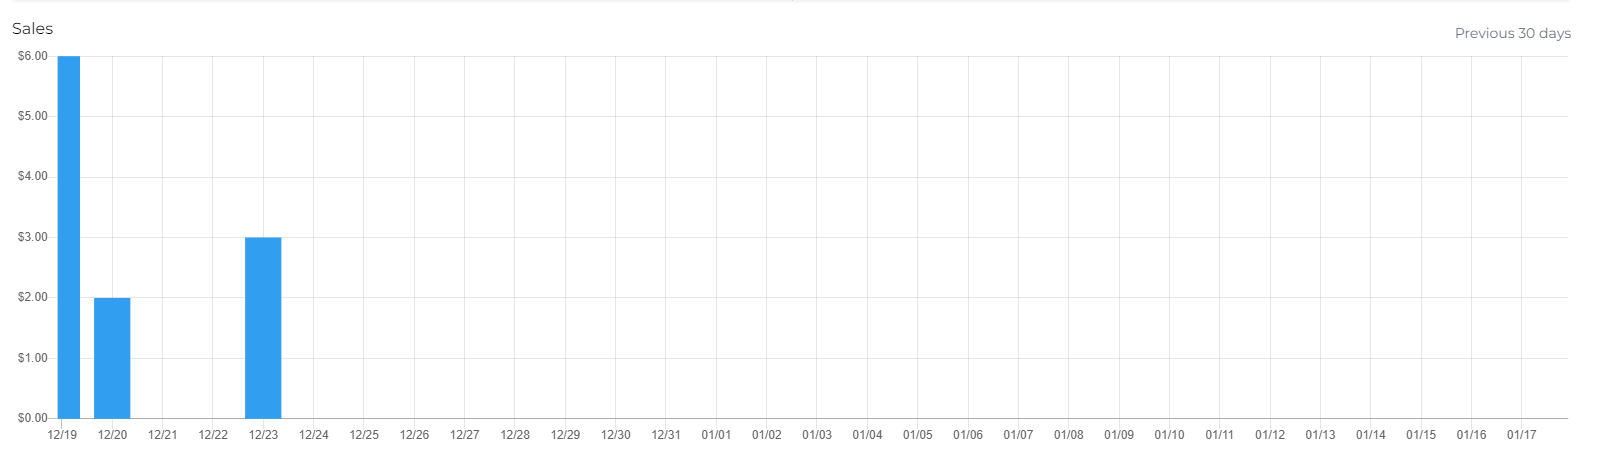
Sales chart
- This bar chart shows a sum total of the value of all promotion sales from your store by date for the past 30 days.
- Note: Marketplace promotion revenue estimates are not included in this data.
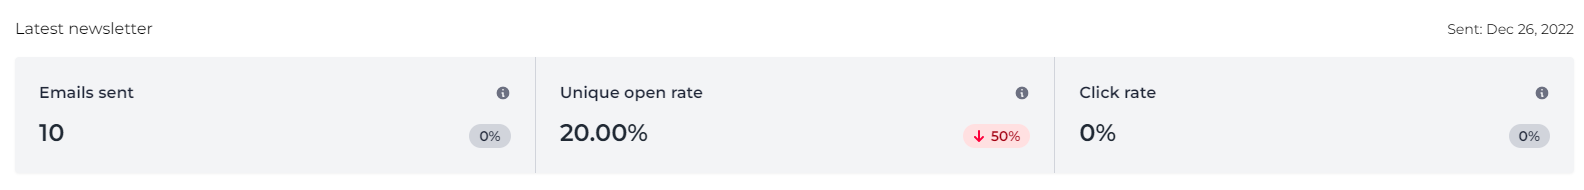
Latest Newsletter
This section displays data about your most recently sent newsletter.
The date of the most recent sent newsletter is displayed in the top right of this section.
- Emails sent
-
- The total number of emails sent for the most recent published edition of your newsletter.
- This count reflects the number of unique subscriber emails that your newsletter was sent to.
- Percent change shows the total number of emails sent for your most recent edition of your newsletter in comparison to the previous published edition.
- Unique open rate is the percentage of unique recipients who opened the newsletter.
- The unique open rate is based on the rendering of an impression pixel when a newsletter is opened. If an end-user disables image loading in their emails, the impression pixel will not render and no open will be recorded.
- Unique click rate is the percentage of unique recipients who clicked on at least one link in the newsletter.
- The unique click rate only counts the first click from each unique subscriber. If a subscriber clicks on more than one link in the newsletter, there will be no change in the unique click rate.
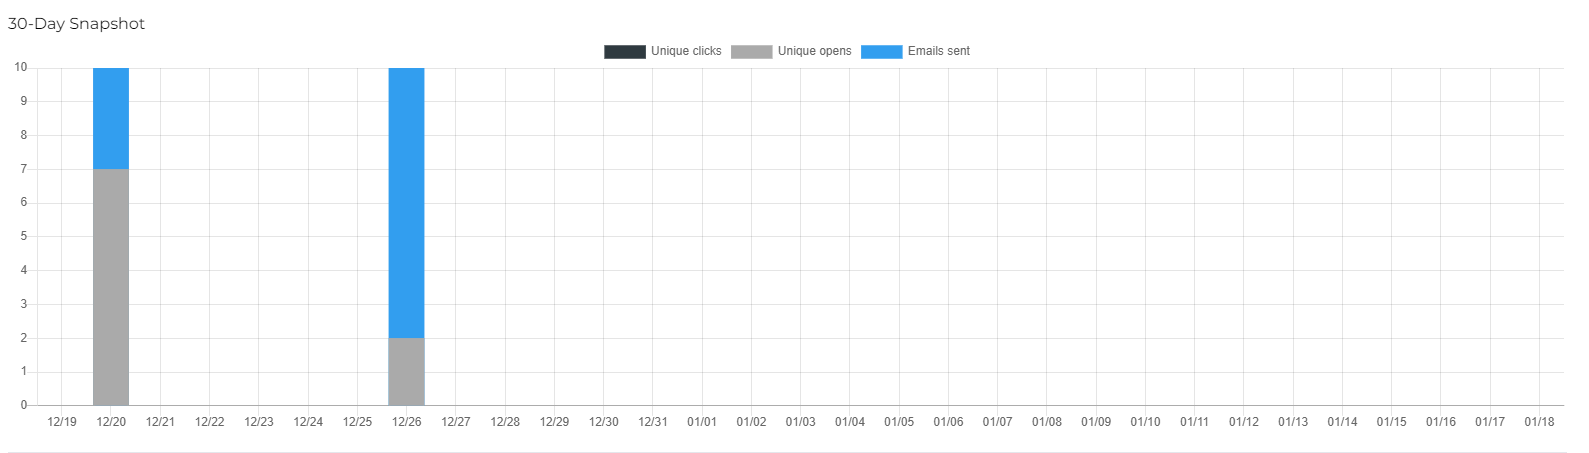
30-Day Engagement Snapshot
This bar chart displays the last 30 days of engagement activity by newsletter edition, including the total counts of emails sent, unique opens and unique clicks.
- Each newsletter edition is represented by one bar and one vertical line on the graph.
- This is a stacked bar chart, so one bar is broken down into 3 categories. Hover over each bar the newsletter title as well as the totals of the 3 categories:
- Emails sent
- Unique opens
- Unique clicks
- Note: These counts are updated daily, so the numbers may change over time.